> ## Documentation Index
> Fetch the complete documentation index at: https://docs.phantom.com/llms.txt
> Use this file to discover all available pages before exploring further.
# Mobile web debugging
> Debug your mobile web dapp in Phantom using Safari for iOS or Chrome DevTools for Android.
Watch [How to debug your dapp on iPhone using Phantom](https://www.loom.com/share/1b1817d84af649c9a38e5dbd8ed25ca9?t=1) on loom.
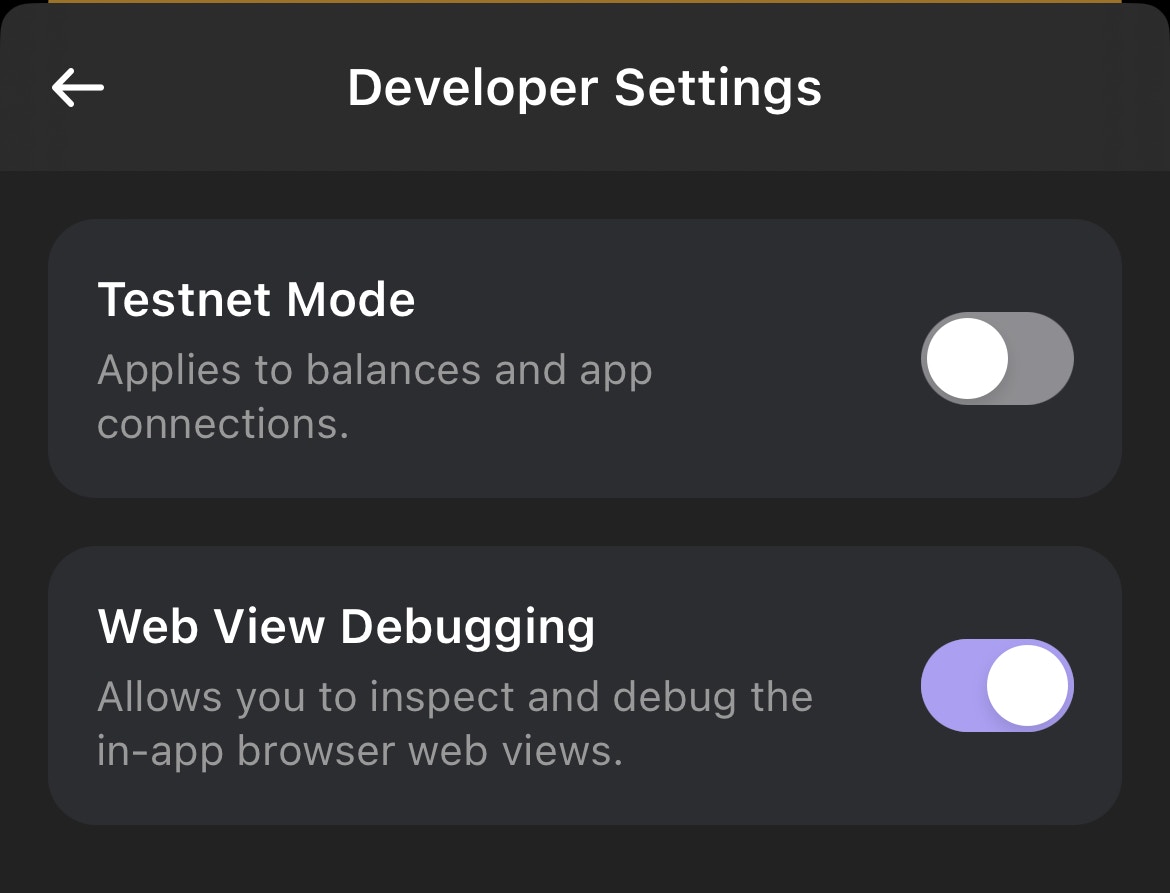
Developers can debug their mobile web dapps using PC browsers. To enable this in Phantom mobile, go to **Settings** > **Developer Settings**, and toggle **Web View Debugging** on. Then follow the steps for your platform.
## iOS
1. Tether your iPhone to your computer via USB.
2. On your iPhone go to **Settings** > **Safari** > **Advanced** and turn on **Web Inspector**.
3. On your computer open Safari. Then from the menu bar **Safari** > Settings -> Advanced tab -> turn on **Show features for web developers**.
4. Open your web dapp in Phantom on your tethered device.
5. Back on your computer from the Safari menu bar, go to **Develop** > \[Your device] > \[Your dapp].
## Android
1. Tether your Android phone to your computer via USB.
2. Open your web dapp in Phantom on your tethered device.
3. On your computer open `chrome://inspect/#devices` on Chrome.
4. Select your device on the left and select **Inspect** on the Phantom dapp contents you'd like to inspect.
 For more information, see [React Native WebView debugging guide](https://github.com/react-native-webview/react-native-webview/blob/master/docs/Debugging.md#debugging-webview-contents).